
Need help with your project?

Oops! Something went wrong while submitting the form.


They say it’s better to start a business in the field you’ve been working in for a few years. This way, it’s easier to see the issues and pains your startup can solve.
We can't help but agree with this advice. But let us drop a remark: no matter how amazing your future project seems to be, always start with business analysis. It helps test your hypothesis, save money, and determine the next steps. We can prove our words with this case: read a story about a New York taxi driver and his idea.
Anton came to us with his project. He works as a professional taxi driver in New York, so he knows the peculiarities of the US transportation market and understands the pains of local drivers and passengers.
No wonder Anton’s first startup idea was to make a taxi aggregator platform. Yes, it’s just like Uber, but better.
It’s clear why he chose this area: our client is an expert. He knows the behind-the-scenes life of taxi depots pretty well: how to save money and what pains are not solved by the existing platforms.
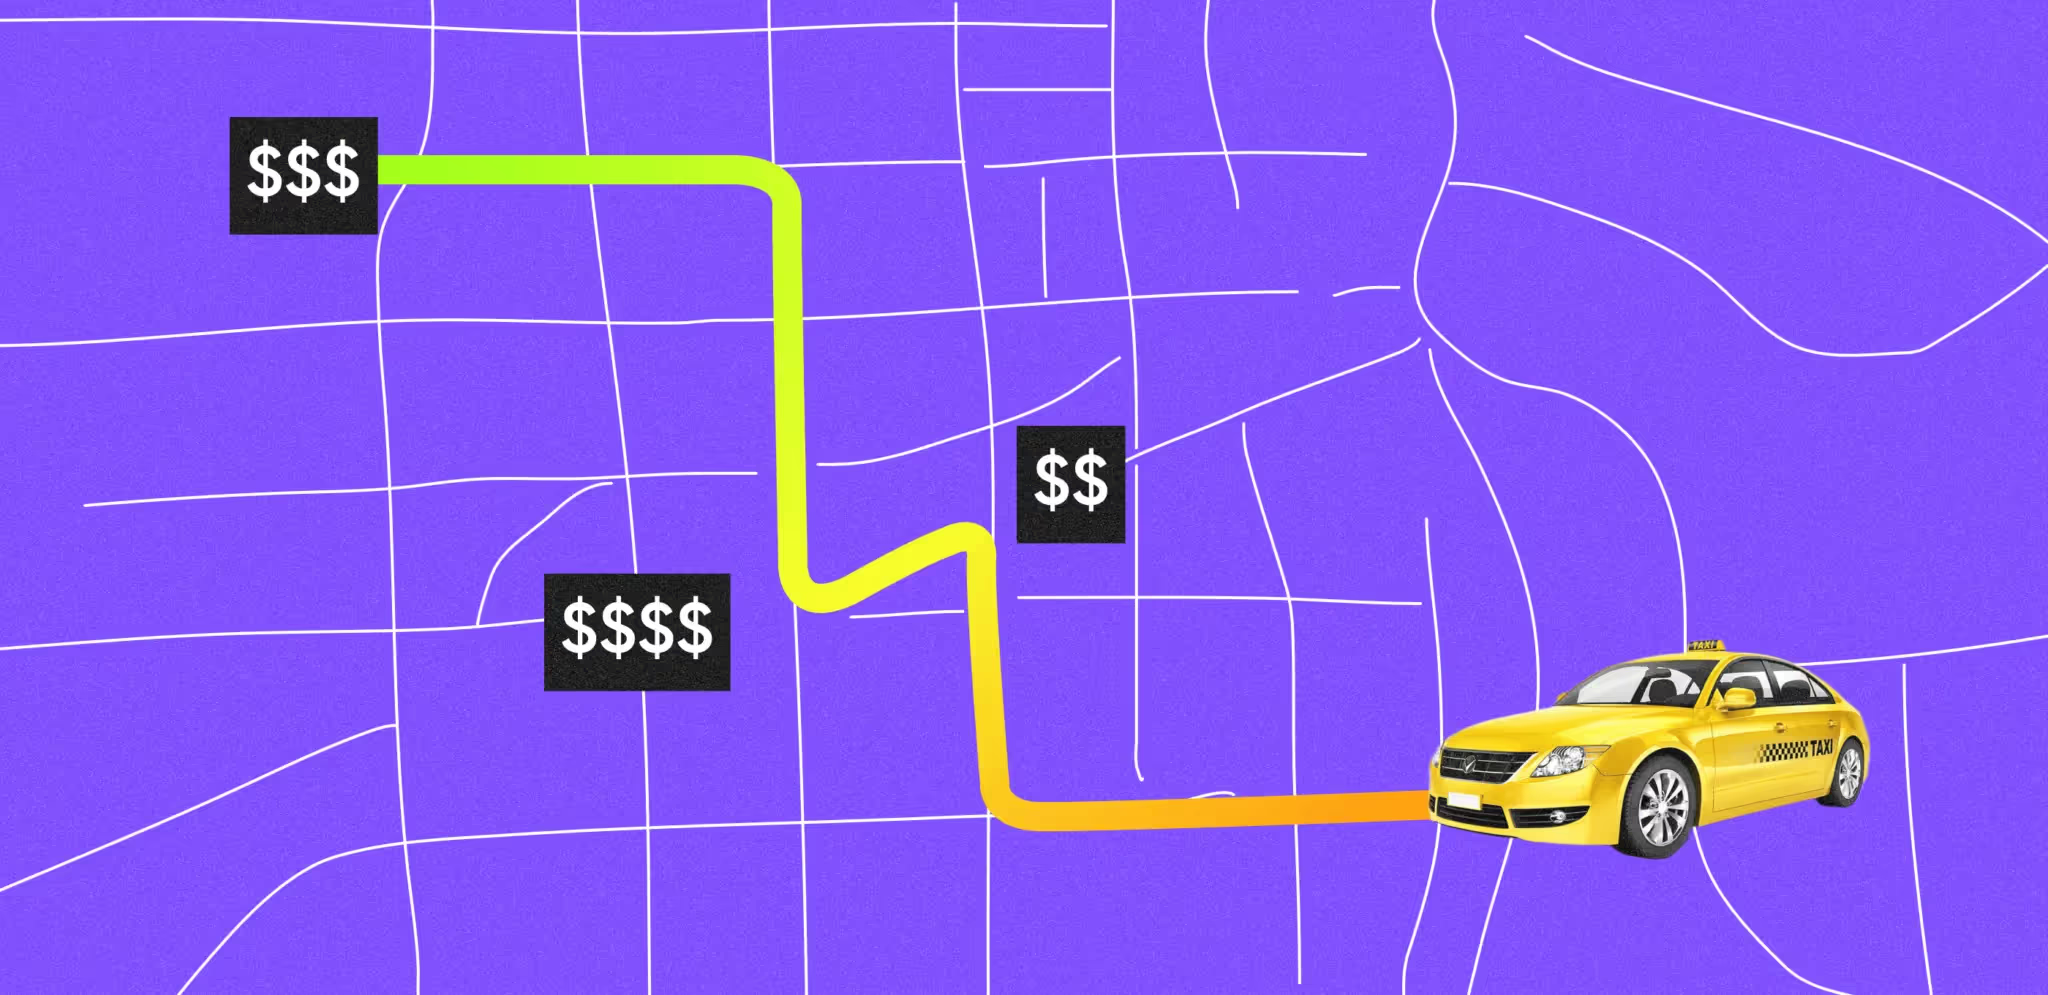
Anton decided to make a web service where users can plan trips with familiar drivers. The idea was to let users select specific taxi drivers and make orders with a unique ID in the form of a QR code.
On top of that, the service would be meant for long-distance trips across New York, its suburbs, or to the airport.
The client’s hypotheses:
Apart from the main hypotheses, the client had some technical assumptions. For example, he supposed that a web service would be cheaper than an app.
All the assumptions, hypotheses, and ideas formed a single concept that Anton shared with us. And we suggested checking whether the product would be needed in the market.
It’s better to spend $3,000 and confirm your hypotheses than lose $160,000 on developing an unnecessary project.
It’s even more true for a taxi aggregator. This market is already divided between major brands. If you want to enter it, you should clearly understand which niche to take and how strong the demand is.
The US transportation market is a niche with incredibly high barriers to entry. As a matter of fact, today’s industry was created by the current market leaders: Uber, Lyft, and Curb. And they keep setting trends now.
Everything started in 2009 when Uber emerged and introduced its then-innovative business model.
Today, this economy is called Uberization, which is derived from the brand name. Uber was the first to invent a digital platform connecting sellers and customers. Later, other aggregators, from Airbnb to Etsy, appeared based on this model.
The Uber business model changed the industry really quickly — the ride prices became more affordable, and the time of car delivery was noticeably shorter. In other words, today’s taxi was born.
In 2018, CB Insights experts thoroughly dissected the Uber model with all the company’s subdivisions: from Uber Eats to Uber Rides. We are interested only in the taxi aggregator scheme, and it looks like this.
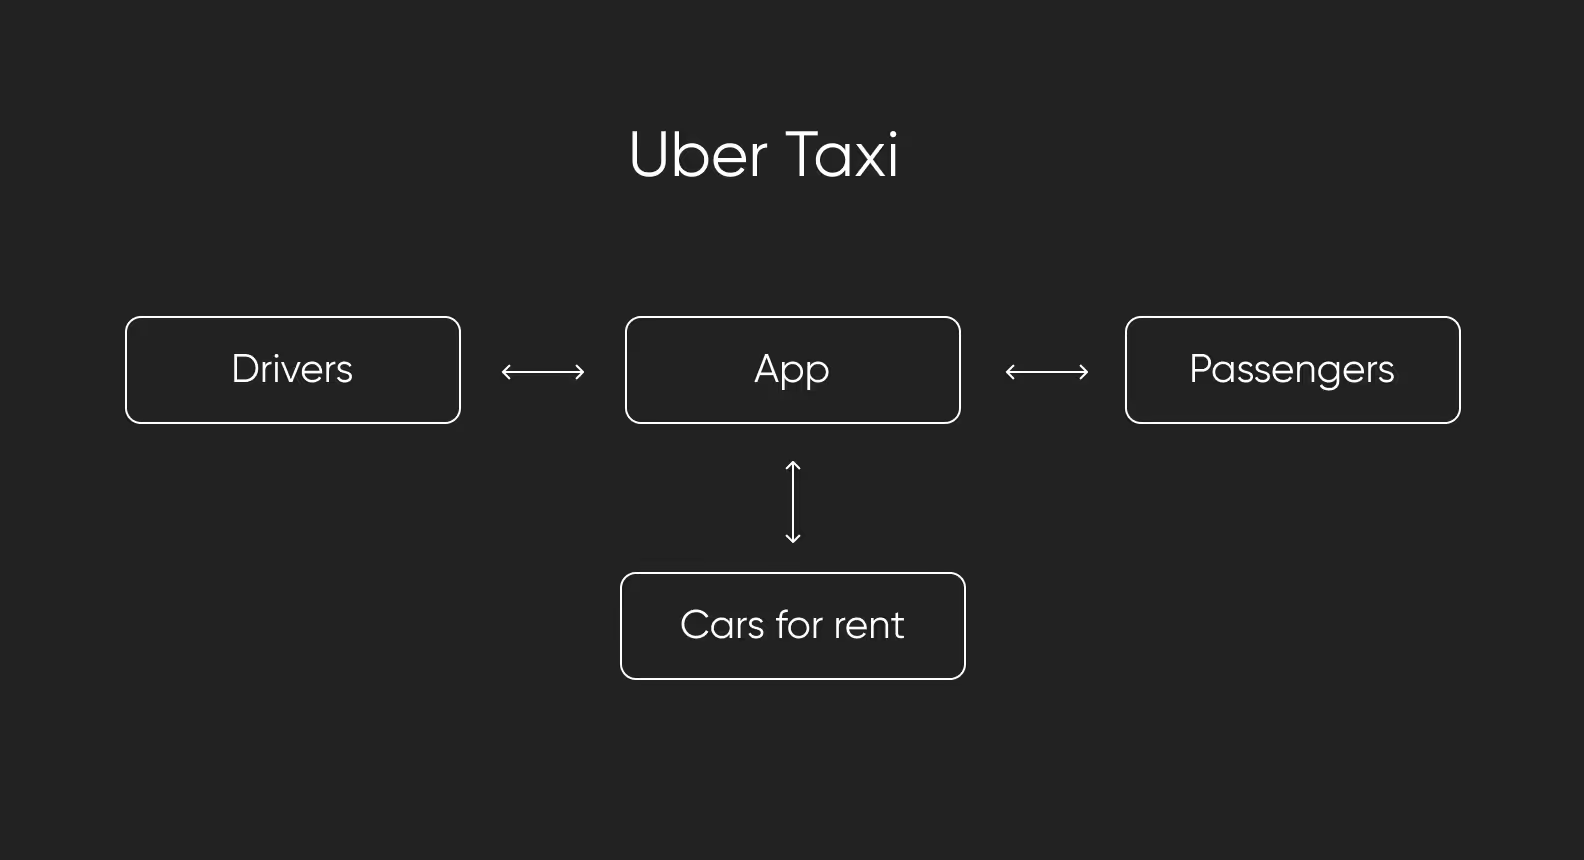
Probably, this model looks familiar to you — today, it can’t surprise anyone, as it’s typical for aggregators. But, as you know, genius lies in simplicity, and Uber has been leading the market for 15 years so far. Still, everything isn’t that perfect.
This all makes a vicious circle. The company has to spend a lot of money on operating costs and skimp on drivers’ salaries. As a result, drivers leave, and Uber has to pour cash to get all the processes right. This is a common problem for all taxi aggregators.
Here, we return to our client’s idea. Again, he’s a taxi driver. Anton knows the policies of the major platforms, and that’s why he decided to build his product in a different way.
He wants to take all the best of the aggregators — the business model idea and the convenience of the digital platforms. But it’s necessary to get rid of the high operating costs to increase the drivers’ salaries.
This solution has many positive points: only loyal and professional drivers stay in the service, and it is more convenient for them to search for passengers via a digital platform. At the same time, the constant comfort and familiar aggregator platform attract more passengers.
This looks nice. But do passengers’ priorities and the client’s values actually match? Will this app find its place in the market?
Our analysts looked into these questions. By that time, we had already evaluated a super-app idea for the Muslims. We took the taxi aggregator idea with even more enthusiasm.
Before starting the research, we attentively listened to everything the client had to say and built an Impact Map. This tool helps to clearly articulate the goals of the future project and how it should impact users. In other words, the map helps turn abstract ideas about the future business into specific business metrics and strategies to achieve them.
Basically, the tool works like this: create a table with four squares and, in each square, write answers to one of four questions: Why?, Who?, How?, What?

We upgraded the scheme to take more aspects into consideration. This is what we got.

The map helped us make the client’s concept more specific. For example, we learned that, in the future, Anton plans to introduce a corporate subscription strategy and services for kids. Also, we found out that neglected cars and traffic rule violations are common pains that bother the target audience.
All this helped us identify the further steps. The next stage is to determine needs in the JTBD format.
We described the pains of the target audience in the Jobs-To-Be-Done (JBTD) format. In other words, we studied the users’ needs through a context and trigger.
In total, we identified 6 key needs:
After that, we identified a segment the future project will be useful for.
They are the passengers who order a taxi for long-distance rides in New York.
Based on our ideas about the target audience and their needs, we made a list of questions for the interview and started searching for respondents to conduct qualitative research.
In this project, we conducted qualitative and quantitative research at the same time. In both cases, our goal was to test the same hypotheses but get results in different formats.
Qualitative research gives us detailed insights. That’s why it was crucial for us to find respondents who totally fit the target segment. We chose the payable New Yorkers who use taxis.
During the qualitative research, we asked about:
Here are a few insights from the interview.
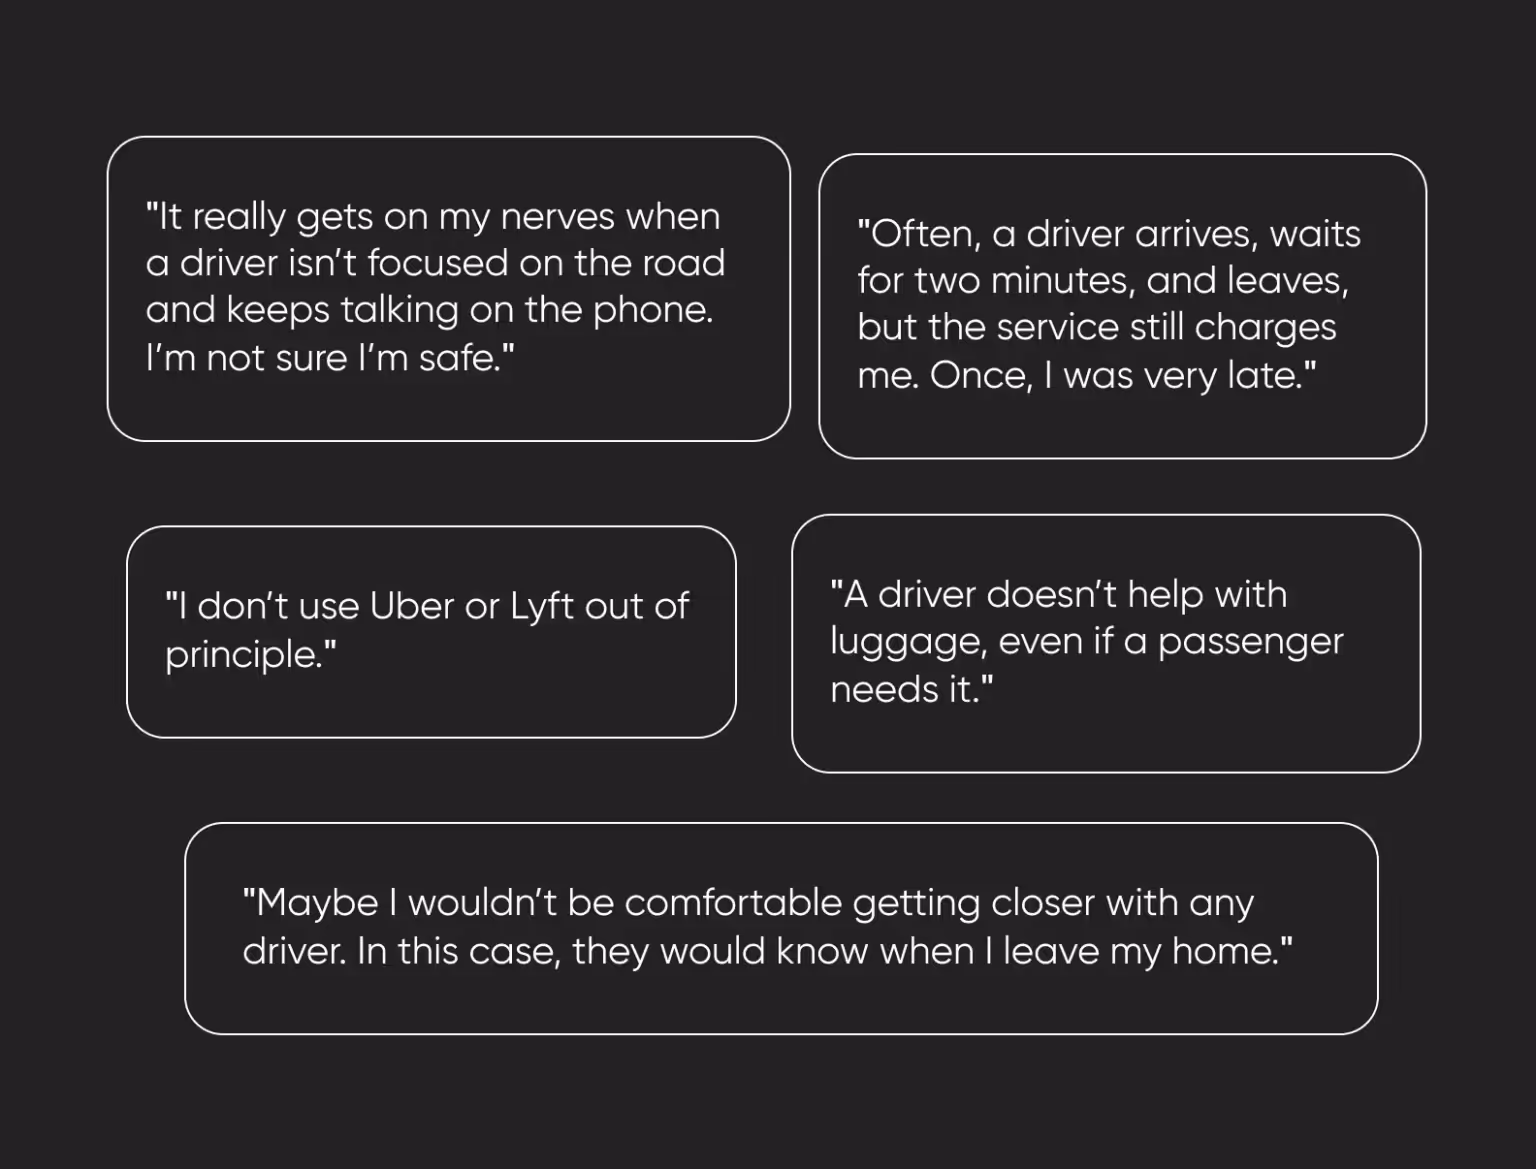
The qualitative research showed that some respondents actually needed to have long-distance trips with familiar drivers. On top of that, the respondents are ready to plan such rides beforehand.
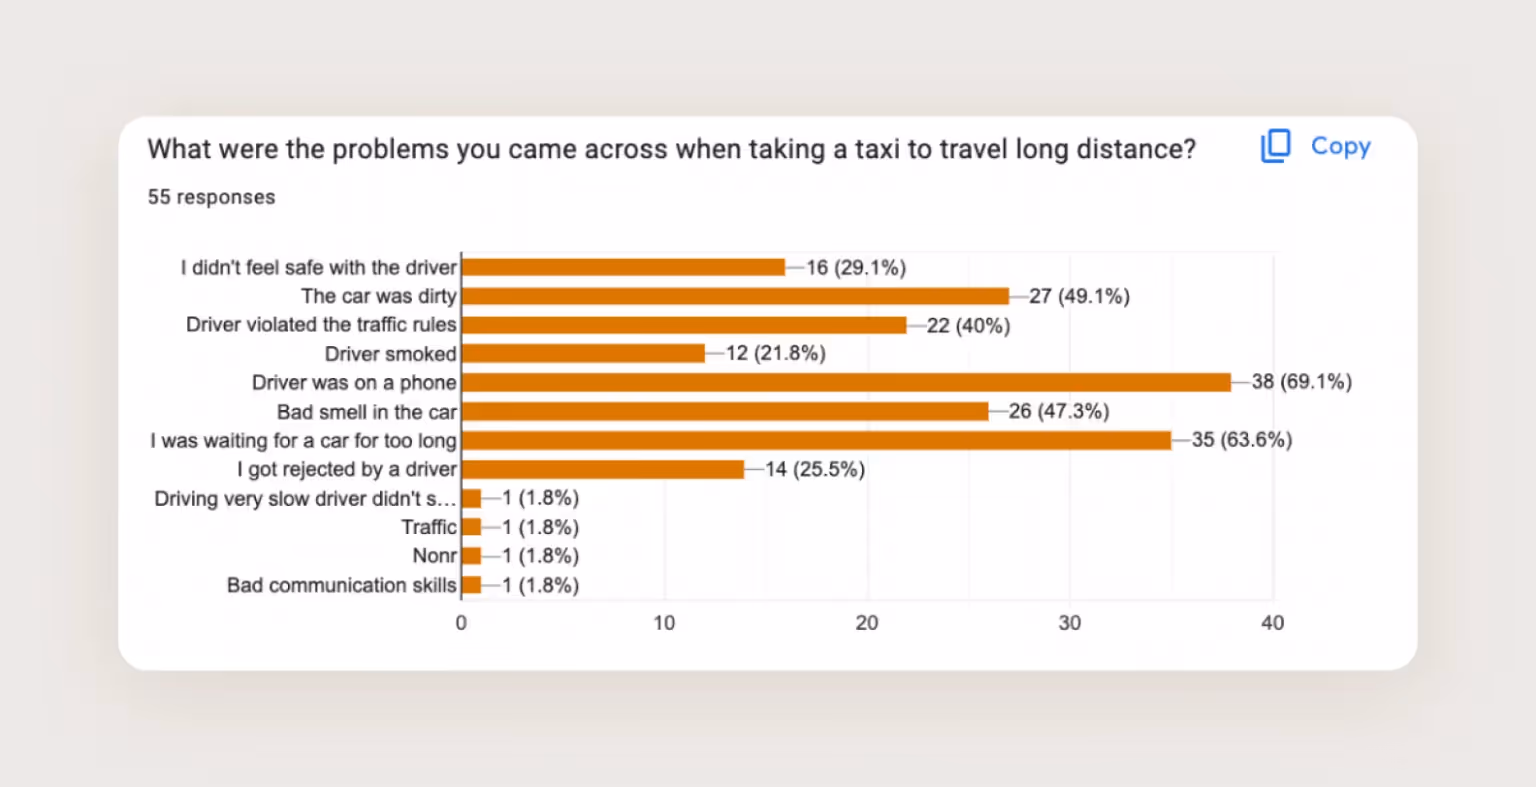
In most cases, they complained about some unpleasant smell in the car, as well as drivers talking on the phone or scamming users by leaving before the passenger came.
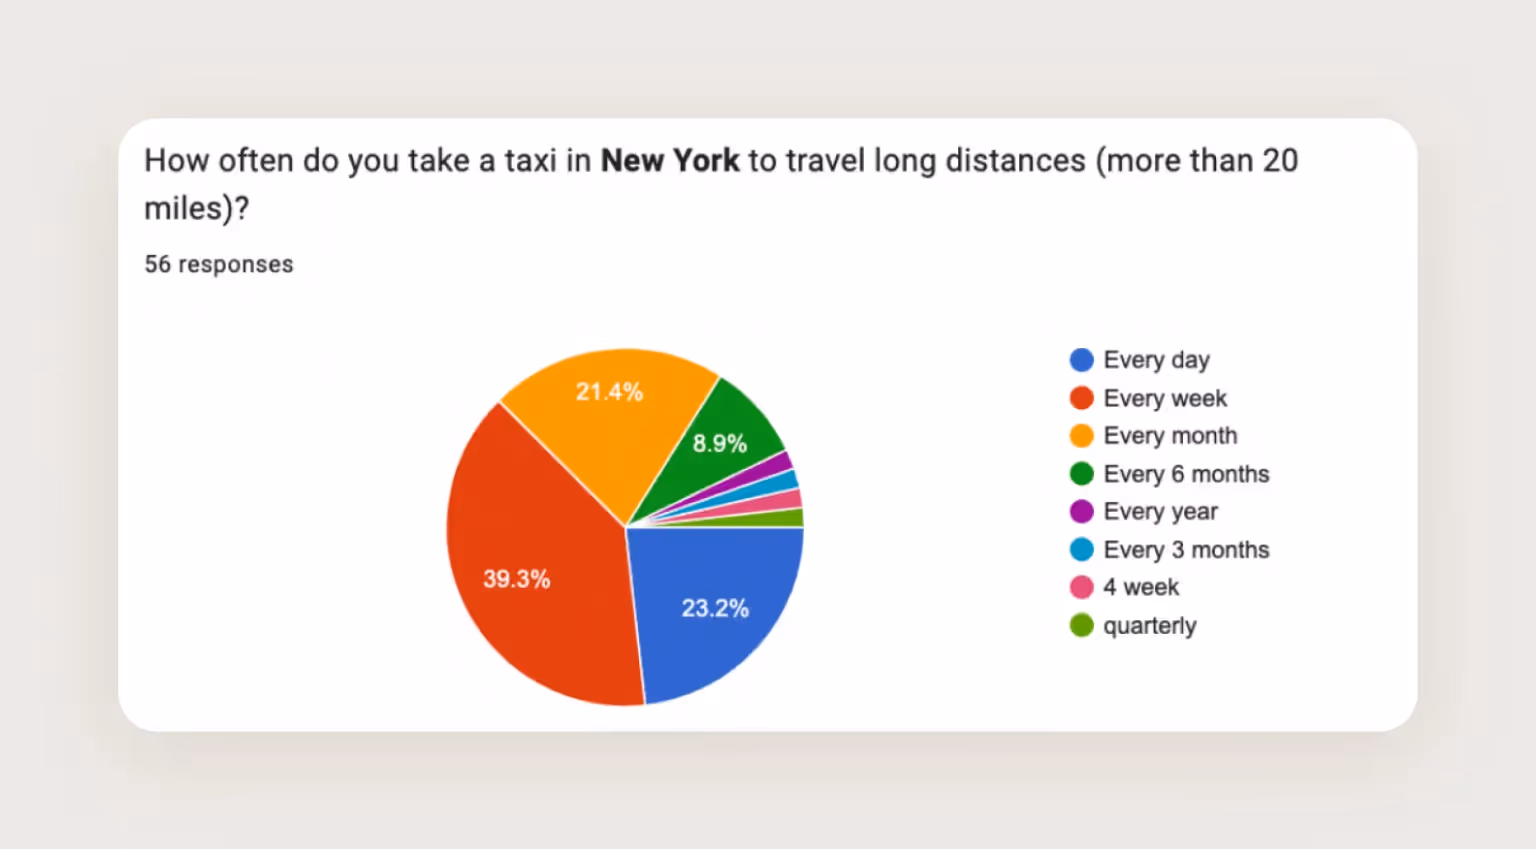
The next step was to check the insights from the qualitative research in the quantitative analysis. This is what we found out.
Over 39% of respondents take long-distance rides every week.
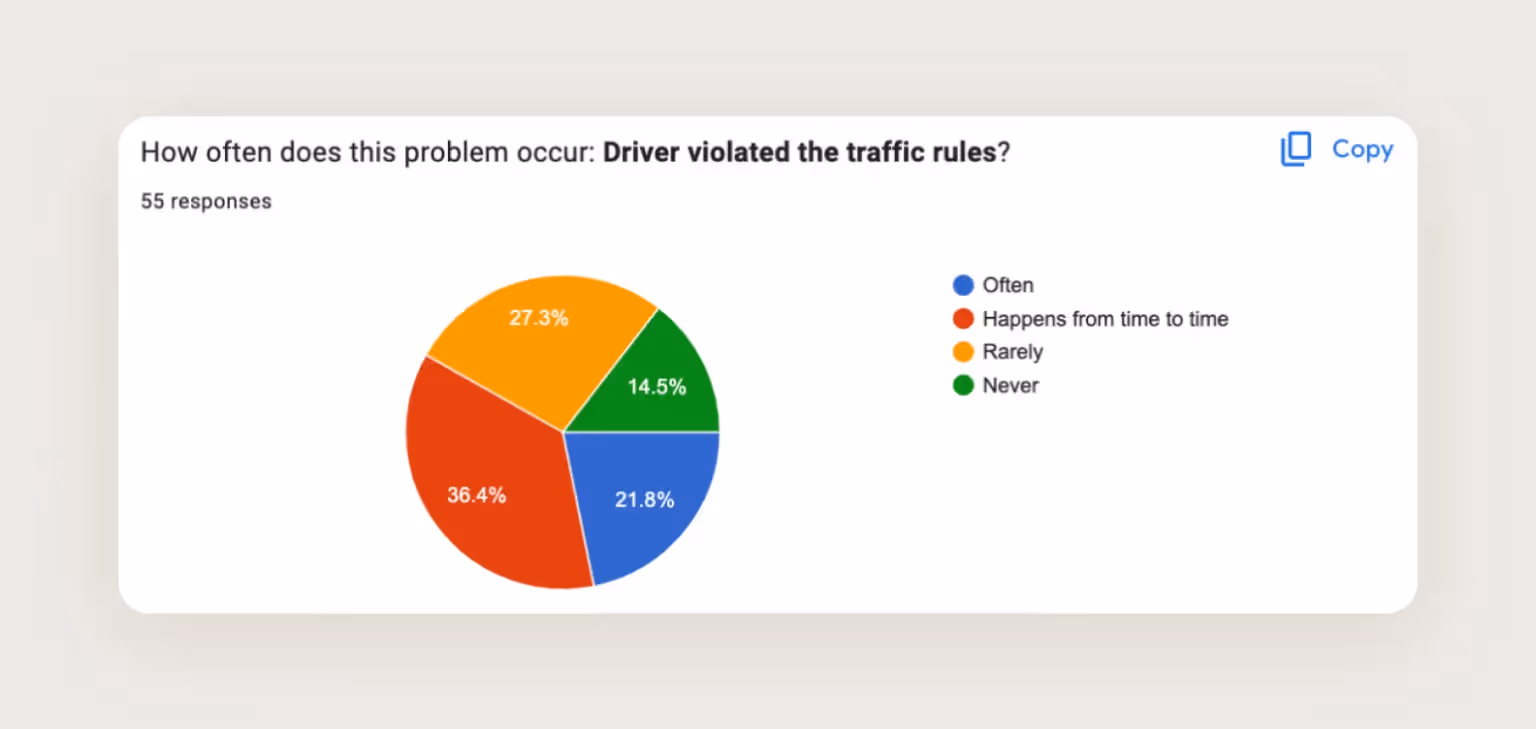
However, these issues don’t occur that often. For example, according to the quantitative research, respondents only occasionally or rarely see drivers violating traffic rules.
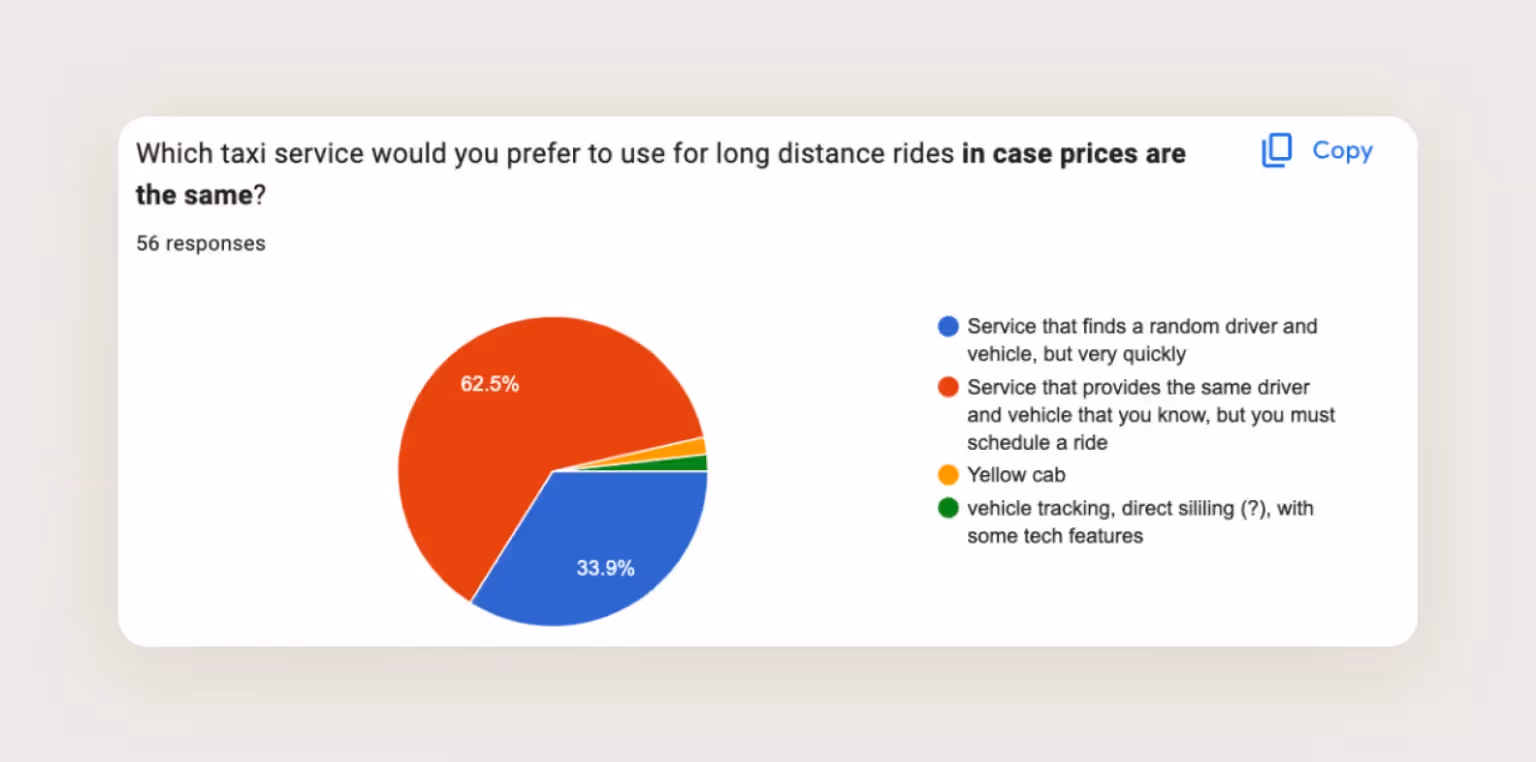
Over 62% of respondents are ready to plan a trip in advance.
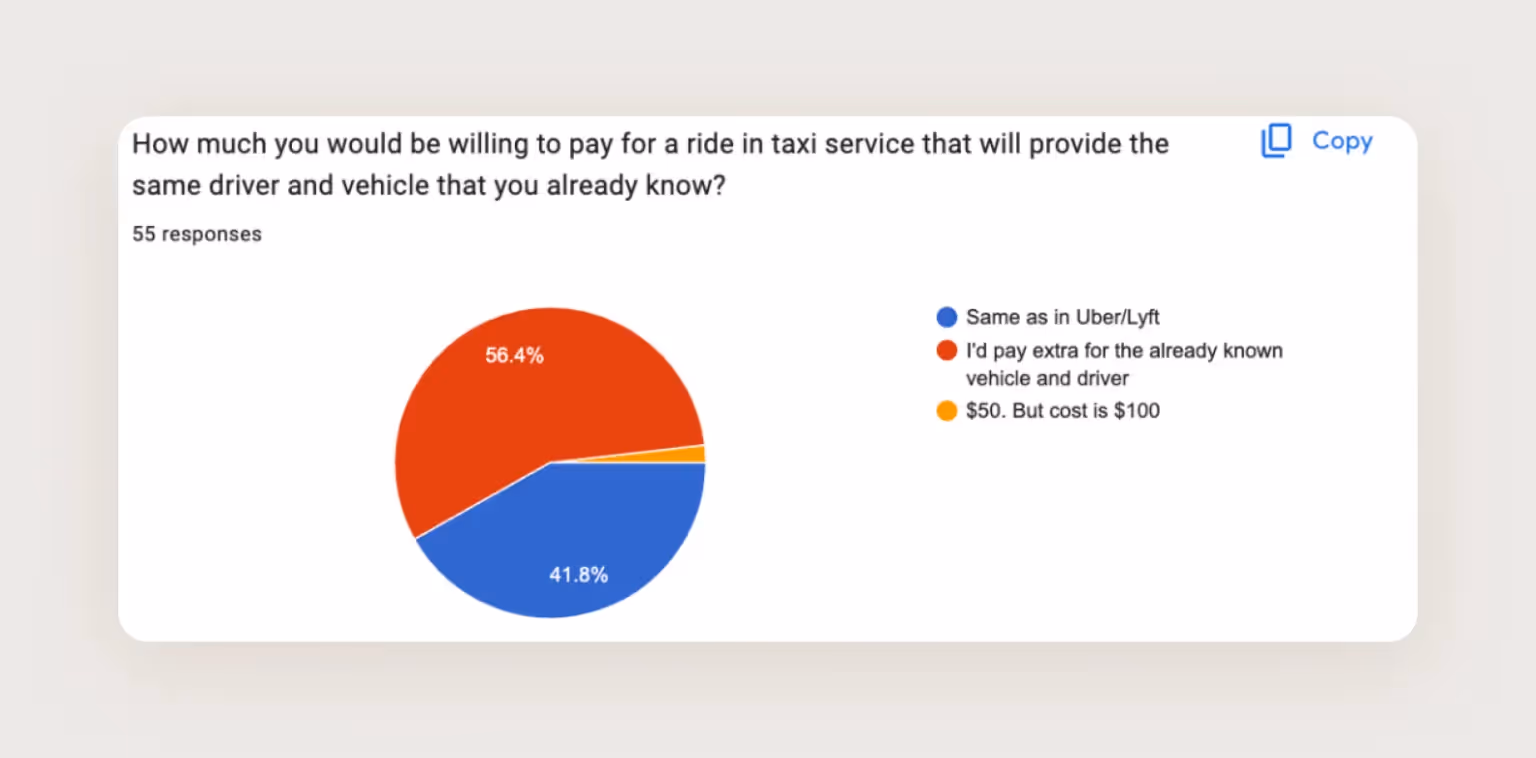
Moreover, some respondents are willing to pay more than they would for Uber.
Intermediate results support the client’s idea. Now, we go to the next analysis stage — calculating the unit economy.
We were analyzing the unit economy for a month. To calculate it, we selected two attraction channels: the one that cost $2 and the free one — the QR code applied during the ride.
Our calculation was based on the hypothesis that a free channel would attract 200 users while the paid one would bring 1,000 users.
These are relevant numbers for the economy with such a conversion — especially since it will be actually helpful for a user right away, as it covers their needs. We found this out during qualitative and quantitative research.
Result: During the first month, this business model will bring in $7,900. This is a strong economy.
When the research was over, we showed our findings to the client.
Users will find value in his aggregator. Respondents appreciate comfort during long-distance rides and are ready to sacrifice their time for it.
This means that the client can start developing his product with full trust in his idea.
➡️ If you want to test your project idea, <a class="blog-modal_opener">fill out the form</a>. We will study your project and offer possible options to check your idea’s viability.

.svg)


%20(1).avif)